Creating Data Visualizations with Spotify Data | Nicole Crosdale
About This Video
This workshop is targeted toward those who are new to coding. This presentation will teach an individual how to analyze their personal Spotify data, create visualizations and prepare their data to be used in business processes. This demonstration will use Python so a new coder will understand foundational coding syntax that can be used in other languages.
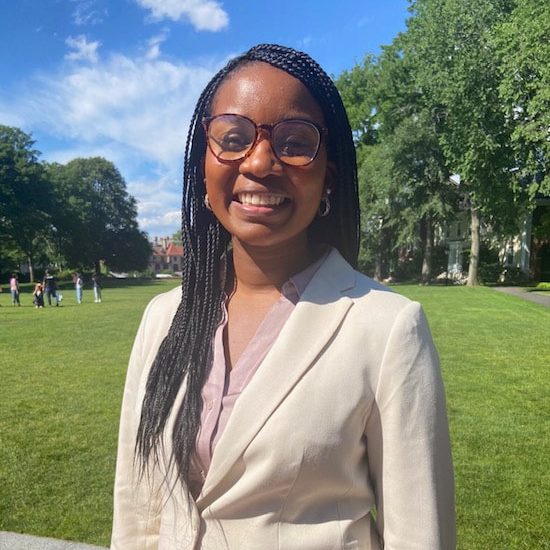
This workshop was conducted by Nicole Crosdale, a Graduate student at the University of Florida.
Resources and slides for this workshop: https://bit.ly/spotify_resources
In This Video

Business Analyst, Carnival Cruise Line
Nicole is a recent graduate from the University of Florida with an interest in Data Analytics. She is intrigued by developing studies and using data to find relationships between variables that are used to make impactful decisions. Nicole has had the chance to apply these skills in different fields like the medical technology, restaurant, and consulting industries. She is passionate about storytelling with data and helping businesses understand how they can use AI to improve their strategies.

